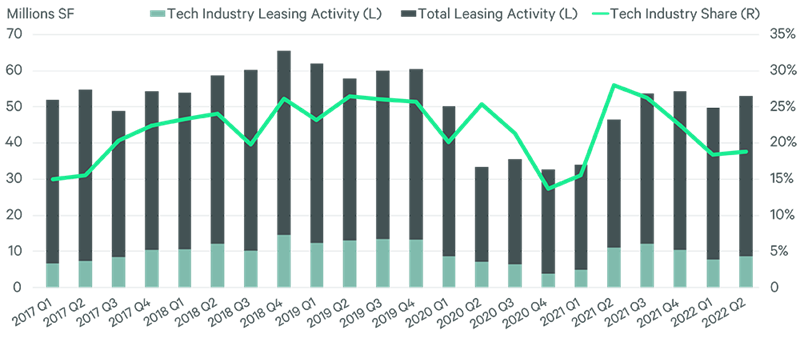
Economic uncertainty and low space usage contributed to a negligible 1% year-over-year increase in tech office leasing volume in H1 2022. Long the leading industry for office leasing, tech’s 16.16% market share was slightly lower than professional & business services (16.31%) and finance & insurance (16.22%). Total office leasing across all industries was up by 28% year-over-year in H1.

Year-over-year changes among the 10 markets with the most tech leasing volume ranged from +223% in Chicago to -61% in Seattle. Most of these changes were from relatively low square footage amounts. In addition to Chicago, Manhattan and Austin also had triple-digit percentage increases from relatively low bases. On a total square footage basis, the San Francisco Bay Area was by far and away the leader with 4.85 million sq. ft., up by 31% from a year ago, followed by Washington, D.C. with 1.5 million sq. ft. (+12%) and Austin with 1.3 million sq. ft. (+117%).
As tech companies get more clarity on expected economic conditions and their office utilization levels, they will be able to more confidently act on their space needs.
FIGURE 2: U.S. Office Leasing Activity by Tech Industry, H1 2022
Top 10 Markets by Square Footage Leased

Source: CBRE Research and CBRE Tech Insights Center, Q2 2022. Total leasing activity includes direct, sublease and renewal transactions ≥ 10,000 sq. ft.